![]()
![]()
![]()
![]() Figure 1.1: U.S. Adult Jail and Prison Annual Individuals Admitted, 2022/2023
Figure 1.1: U.S. Adult Jail and Prison Annual Individuals Admitted, 2022/2023
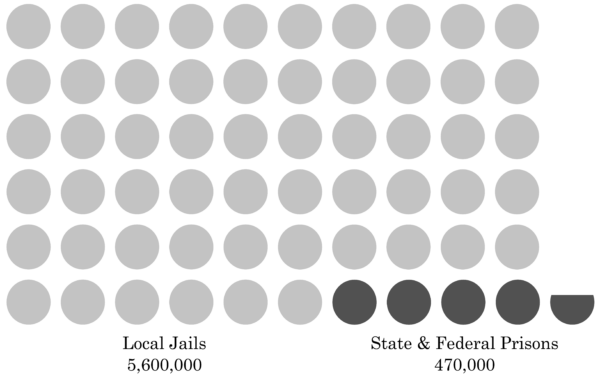
Note: Each circle represents 100,000 individuals. Jail data are from 2023, prison data are from 2022. Source: Jail data, Emily Widra & Wanda Sawyer, Prison Policy Initiative, Who is Jailed, How Often, and Why (Nov. 27, 2024), State and federal prison data, U.S. Dep’t of Justice, Prisoners in 2022 (Oct. 2024).
Figure 1.2. U.S. Jail and Prison Population and Incarceration Rate by Decade, 1880–2022
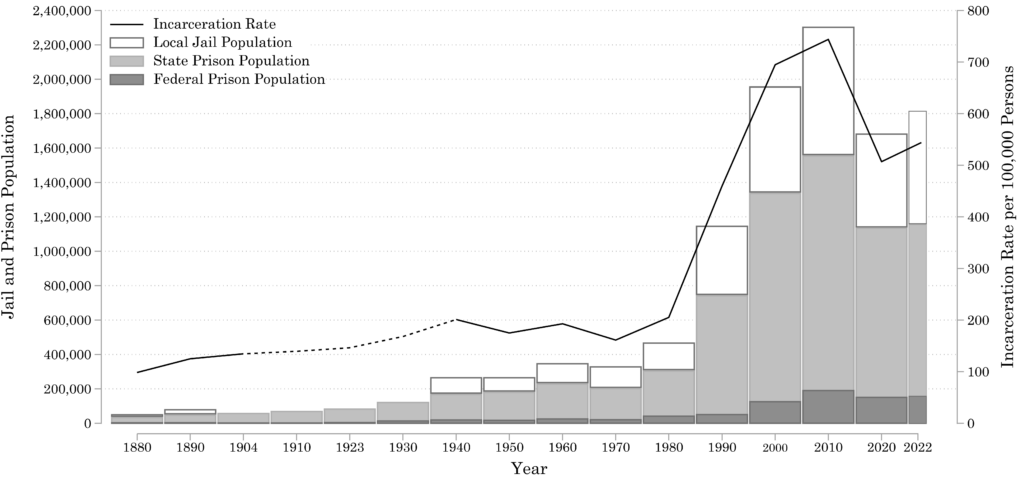
Source: 1880–1960, U.S. Dep’t of Justice, Historical Corrections Statistics
in the United States, 1850–1984 (1986); 1970–2022, varied Bureau of Justice Statistics Reports.
Figure 1.3. U.S. Jail and Prison Population and Incarceration Rate, 1970–2022
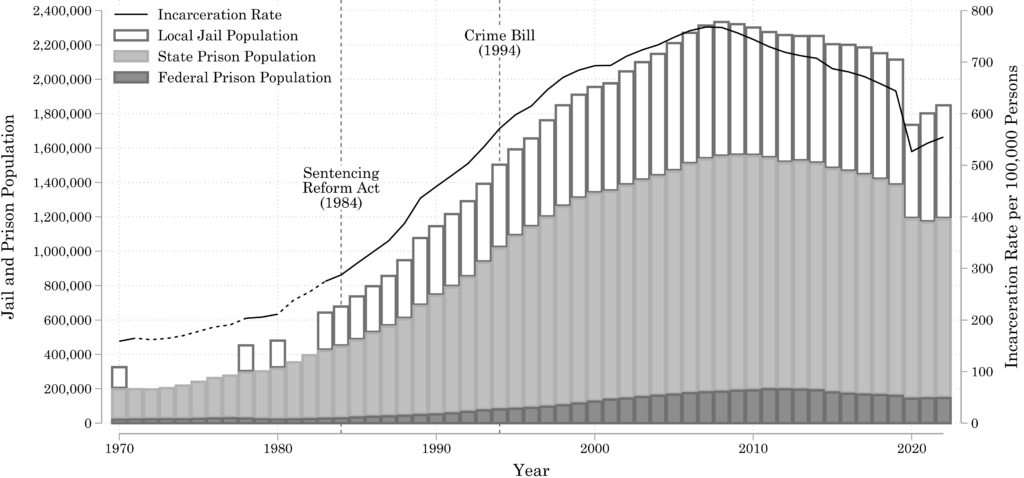
Source: varied U.S. Dep’t of Justice reports.
Figure 1.4: U.S. Local Jail Population by Conviction Status, 1982–2022
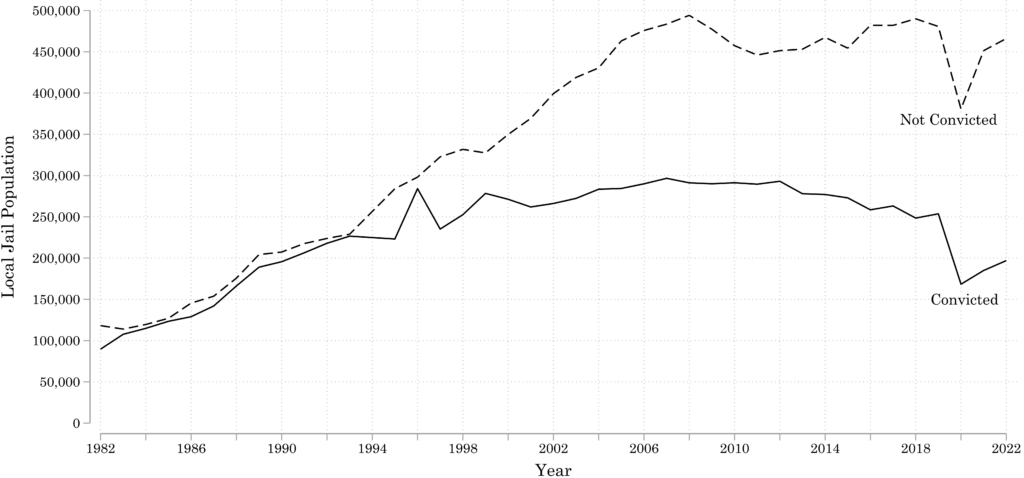
Source: U.S. Dep’t of Justice reports.
Figure 1.5: Local Jail Incarceration Rates by Urbanicity, 1970–2024
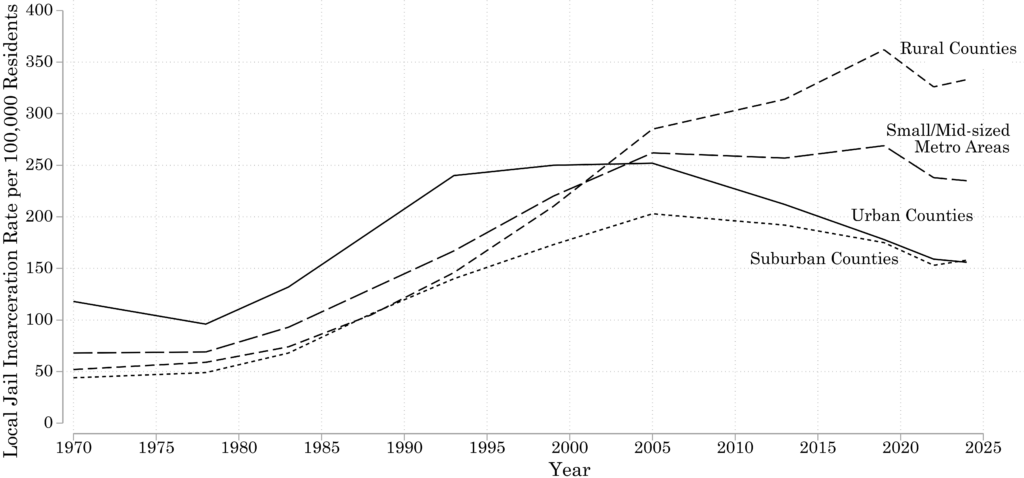
Note: Data are interpolated between 1970, 1978, 1983, 1988, 1993, 1999, 2005, 2013, 2019, 2022, and 2024. Source: 1970–2013, Vera Institute of Justice, People in Jail in 2019 (2019), and private communication; 2019–2024, Jacob Kang-Brown & Jess Zhang, Vera Institute of Justice, People in Jail and Prison in 2024 (Oct. 2024).
Figure 1.6: Immigration Detention, Average Daily Population, 1979–June 2025
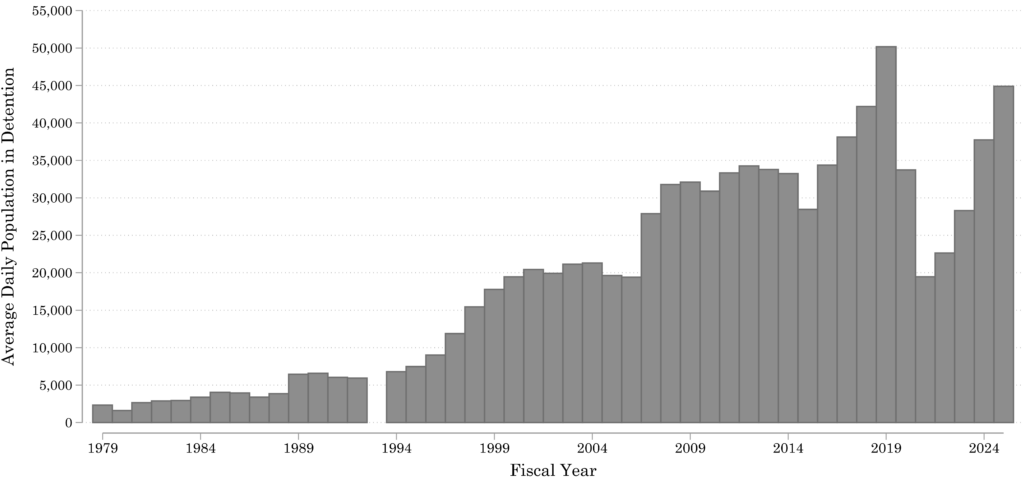
Source: INS/ICE data; publication source varies.
Figure 1.7: International Incarceration Rates
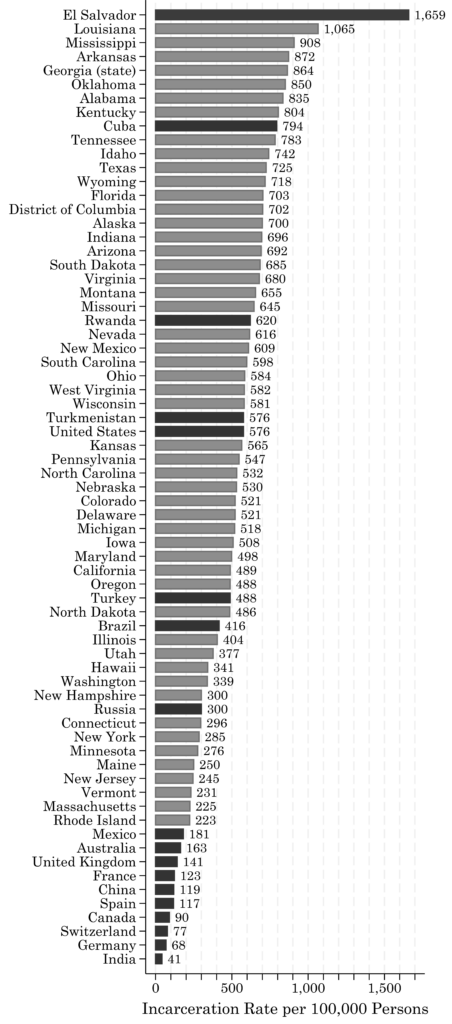
Note: China data from 2018; Cuba data from 2020; Turkmenistan data from 2021; Canada, India, and U.S. data from 2022; France, Germany, Russia, and Spain data from 2023; Australia, Brazil, El Salvador, and Rwanda data from 2024; Mexico, Switzerland, Turkey, and United Kingdom data from 2025. International data source: World Prison Brief. U.S. rates are from Bureau of Justice Statistics reports for 2023.
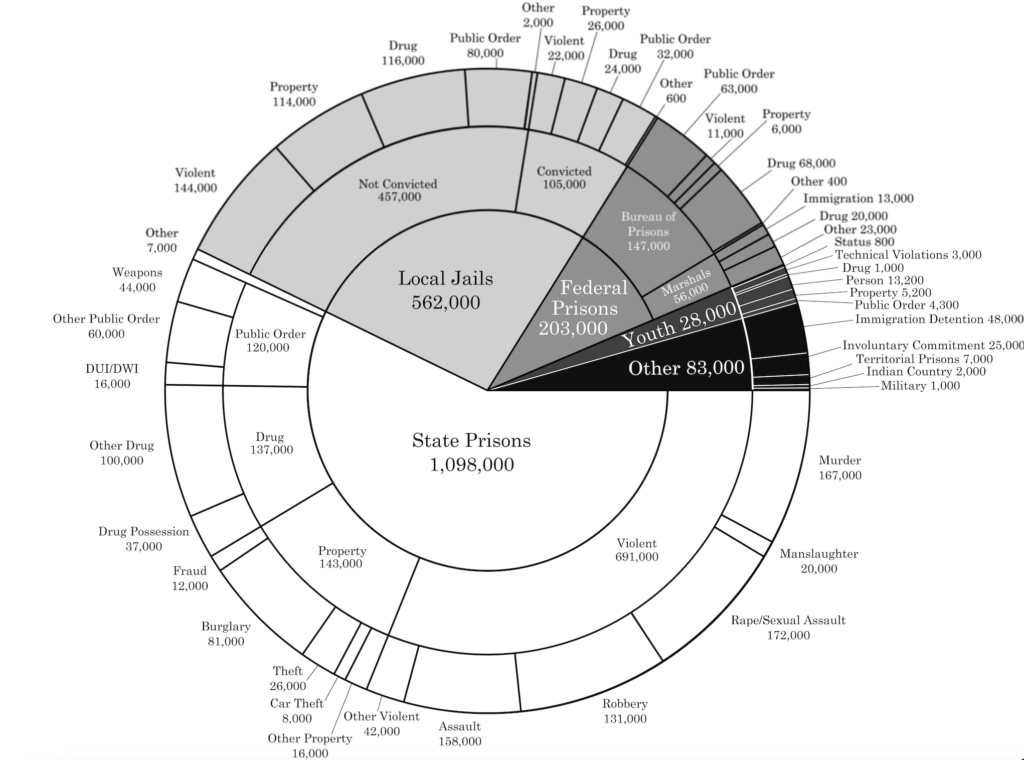
Figure 1.8: U.S. Incarcerated Population, 2025
![]()
![]()
![]()
Source: Prison Policy Initiative, Mass Incarceration: The Whole Pie 2025. Reformatted with permission.
Figure 1.9: State and Federal Prison Population by Criminal Offense, 2021/2022
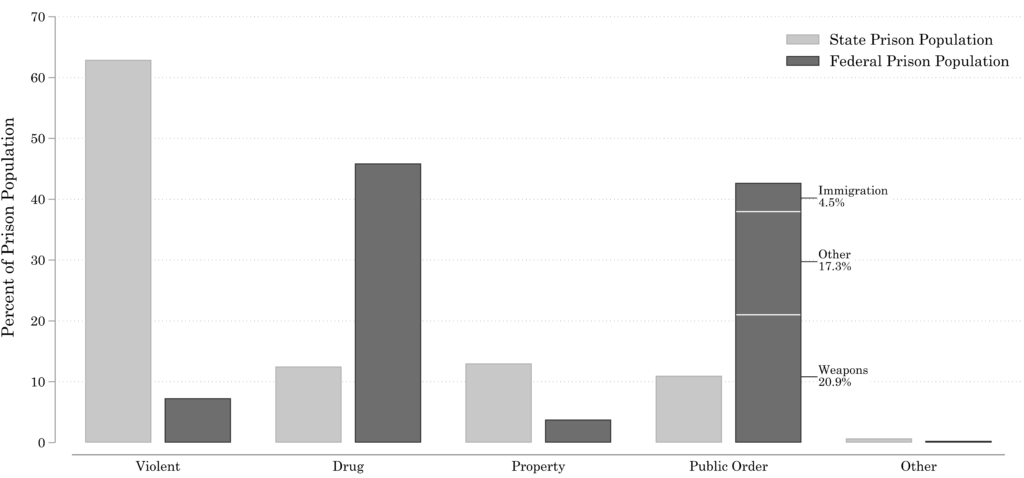
Note: State data from 2021, federal data from 2022. Source: U.S. Dep’t of Justice, Prisoners in 2022 (Oct. 2024).
Figure 1.10: U.S. Prison Incarceration Rates by Gender and Race/Ethnicity, 2022
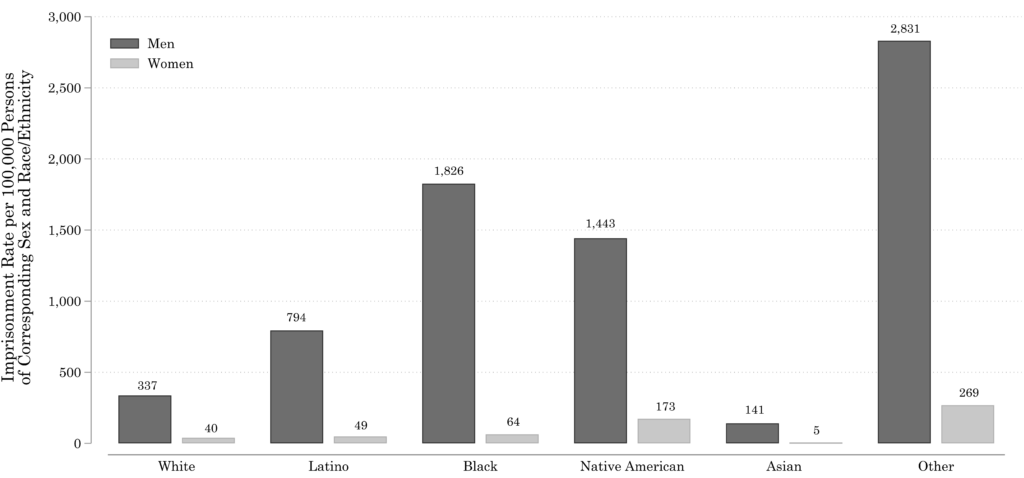
Note: “White,” “Black,” “Native American,” and “Asian” including only non-Hispanic individuals. “Latino” includes Hispanic prisoners of all races. “Other” includes multiracial people and anyone who is otherwise categorized. Source: U.S. Dep’t of Justice, Prisoners in 2022 (Oct. 2024).
Figure 1.11: U.S. Female Prison Incarceration Rate by Race/Ethnicity, 2000–2022
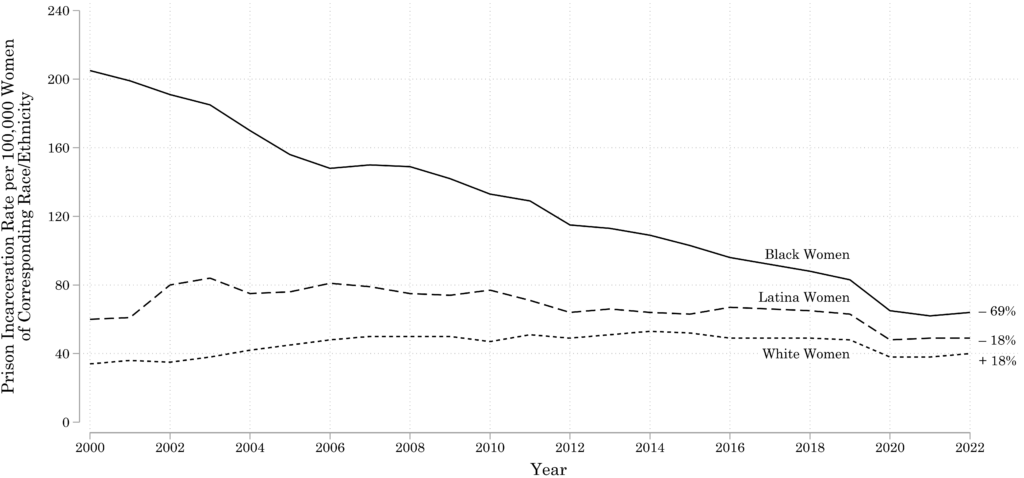
Figures 1.11 & 1.12 note: Percentages on the right indicate the percent change from 2000–2022. “Black” means non-Hispanic Black; “White” means non-Hispanic white; “Latina and “Latino” include Hispanic of all races. Source: 2000–2017, Sentencing Project, Incarcerated Women and Girls (2019), U.S. Dep’t of Justice, Prisoners series (2000–2022).
Figure 1.12: U.S. Male Prison Incarceration Rate by Race/Ethnicity, 2000–2022
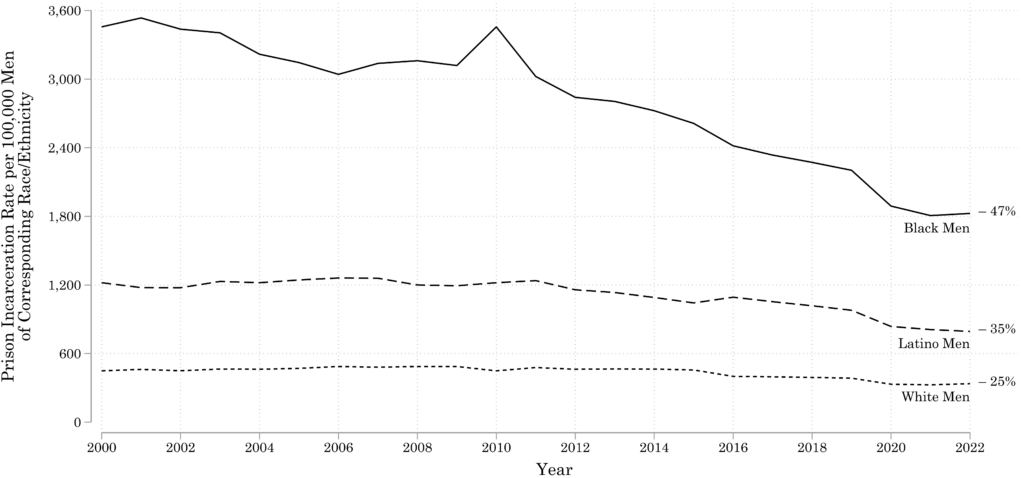
Figures 1.11 & 1.12 note: Percentages on the right indicate the percent change from 2000–2022. “Black” means non-Hispanic Black; “White” means non-Hispanic white; “Latina and “Latino” include Hispanic of all races. Source: 2000–2017, Sentencing Project, Incarcerated Women and Girls (2019), U.S. Dep’t of Justice, Prisoners series (2000–2022).
Figure 1.13: U.S. Corrections Systems Populations, 1980 & 2022
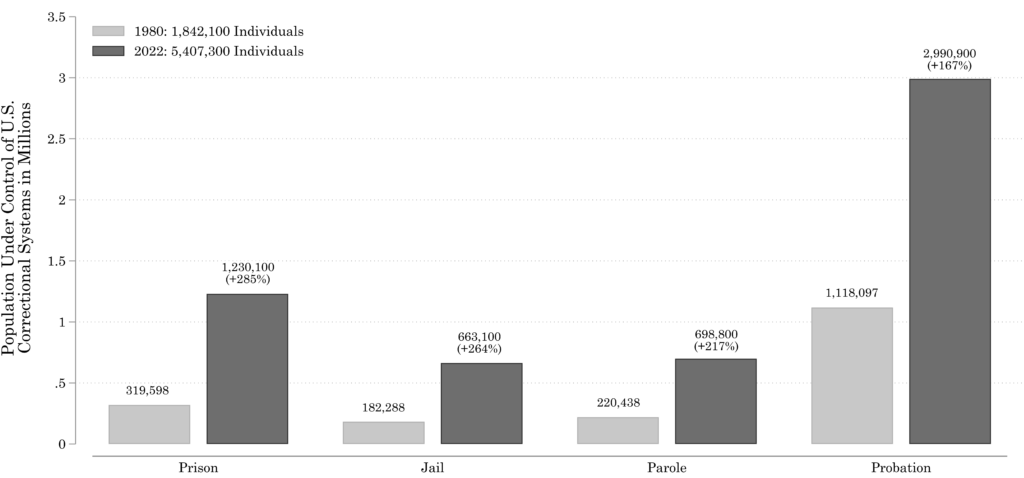
Note: (percentages) denote the change in population size between 1980 and 2022. Source: 1980, Sentencing Project, Trends in U.S. Corrections (2019); 2022, U.S. Dep’t of Justice, Correctional Populations in the United States, 2022 (May 2024).
Figure 1.14: Correctional Control Rate by State, 2023
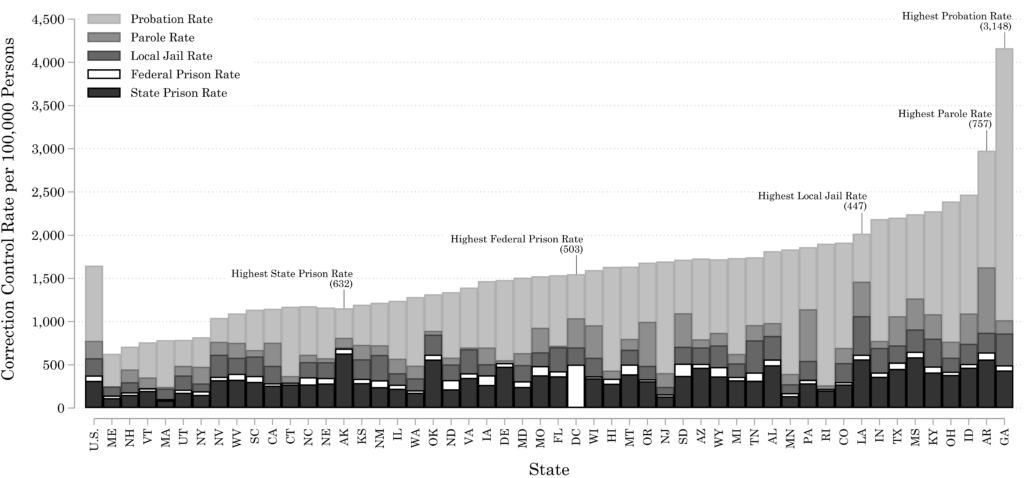
Source: Prison Policy Initiative, Punishment Beyond Prisons 2023: Incarceration and Supervision by State (May 2023).
Figure 1.15: Litigation Rate for Prisoner Civil Rights Lawsuits, 1970–2022
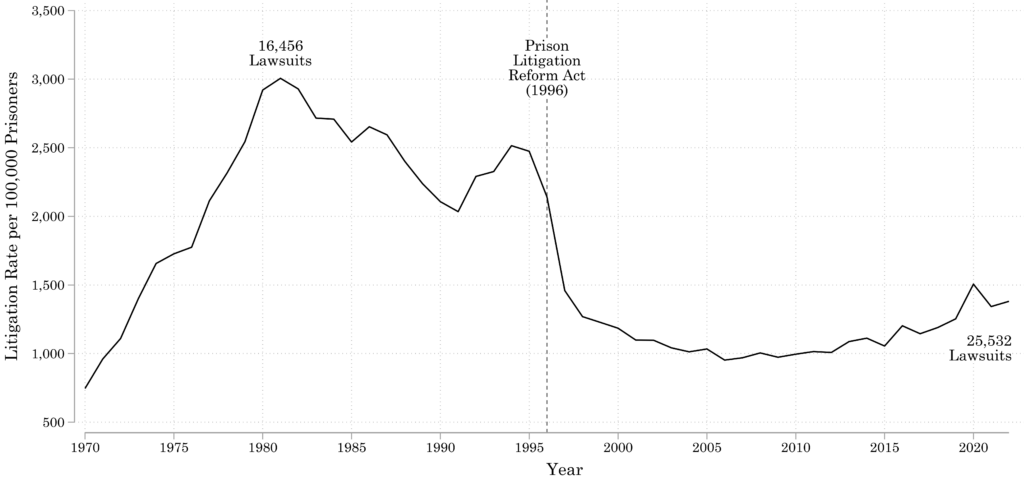
Source: Lawsuits filed: Federal Judicial Center, Civil Integrated Database (IDB); incarceration data, U.S. Dep’t of Justice, Prisoner ![]()
![]() series.
series.
Table 5.1: Sexual Victimization, from Prisoner Survey
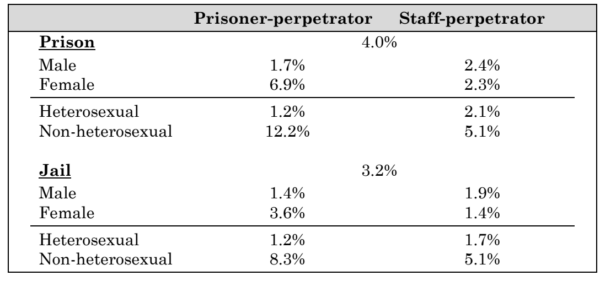
Source: Allen Beck et al., Bureau of Justice Statistics, Sexual Victimization in Prisons and Jails as Reported by Inmates, 2011–2012 (May 2013). For a screen-readable version, click here.
Table 11.1: Incarceration by Gender, 1970-2023
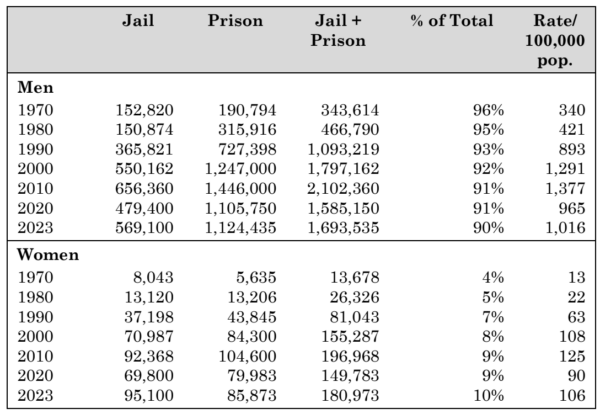
Source: Varied U.S. Dep’t of Justice publications. For a screen-readable version, click here.
Table 11.2 Sexual Victimization by Gender
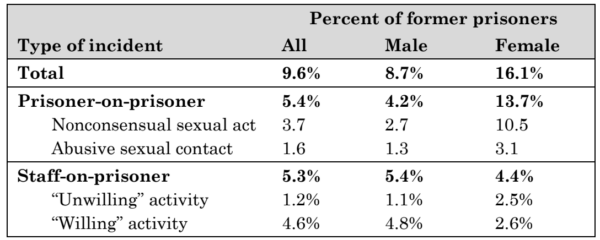
Definitions: Nonconsensual sexual acts—unwanted contact with another inmate or any contact with staff that involved oral, anal, vaginal penetration, hand jobs, and other sexual acts. Abusive sexual contacts—unwanted contact with another inmate or any contact with staff that involved touching of the inmate’s buttocks, thighs, penis, breasts, or vagina in a sexual way. “Willing” and “unwilling” are as reported by the former prisoner—though all staff sexual contact with prisoners is considered nonconsensual. Source: U.S. Dep’t of Justice, Bur. of Justice Stats., National Former Prisoner Survey 2008 (May 2012). For a screen-readable version, click here.
Table 13.1: Disability in Prisons
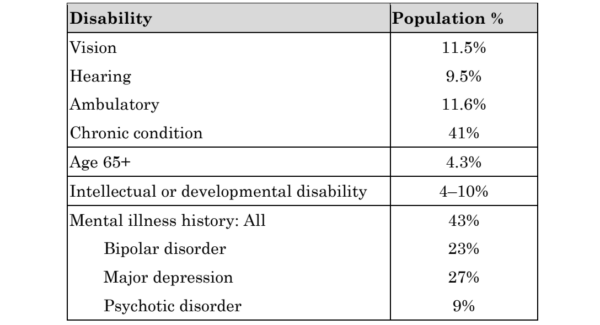
Note: All data is the most recent available, but the dates vary from 2000 to 2022. Sources: Various Bureau of Justice Statistics publications, and Joan Petersilia, Doing Justice? Criminal Offenders With Developmental Disabilities (2000). For a screen-readable version, click here.
Figure 14.1: State Expenditures on Corrections, 1985–2018
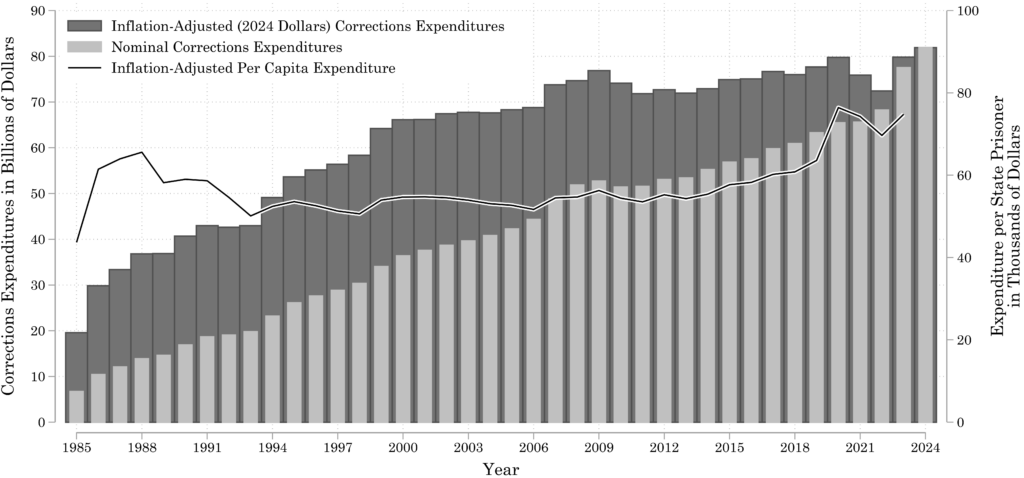
Source: Nominal corrections expenditures data from National Association of State Budget Officers, “State Expenditure Report” Series (1985–2018). State prison population from U.S. Dep’t of Justice, Bureau of Justice Statistics.
Table 14.1: Incidence of Court Orders, Local Jails, State Prisons 1983-2019
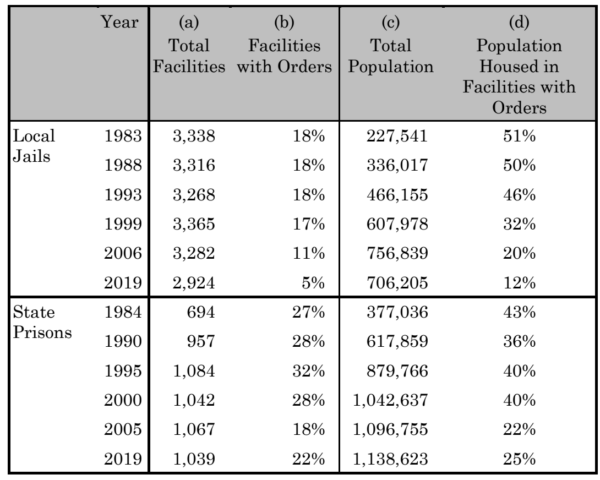
Source: Bureau of Justice Statistics, Prison and Jail Censuses. For a screen-readable version, click here.
Table 16.1: Pro Se Rate, Prisoner Civil Rights Cases in Federal Court
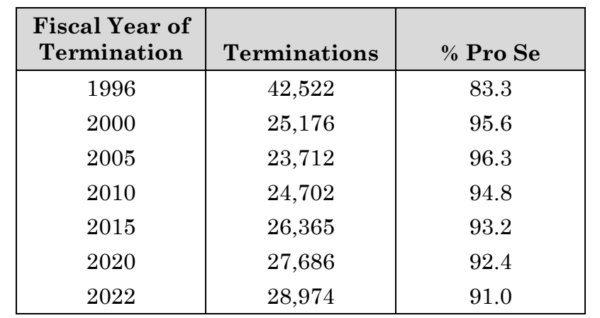
Source: Federal Judicial Center Integrated Database (IDB). For a screen-readable version, click here.
Table 16.2: Federal Court Outcome Statistics
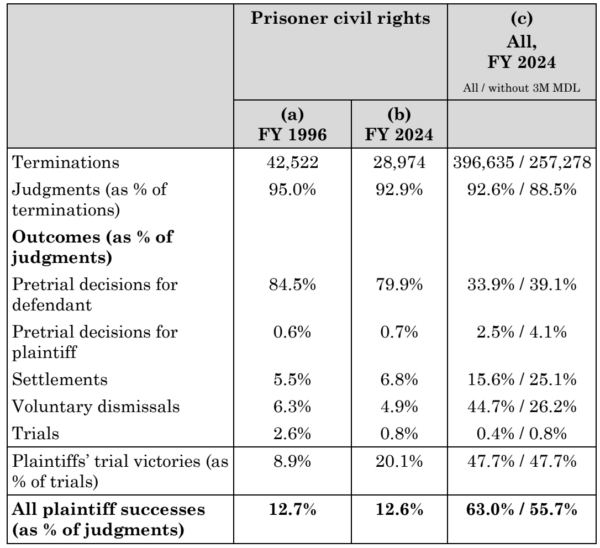
Source: Federal Judicial Center Integrated Database (IDB). The table is reprinted (edited) from Margo Schlanger, Trends in Prisoner Litigation, as the PLRA Enters Adulthood, 5 U.C. Irvine L. Rev. 153 (2015); full explanations are set out there and in the accompanying data appendix. For a screen-readable version, click here.
Figure 19.1: Criminal Disenfranchisement
Laws Across the United States (2025)
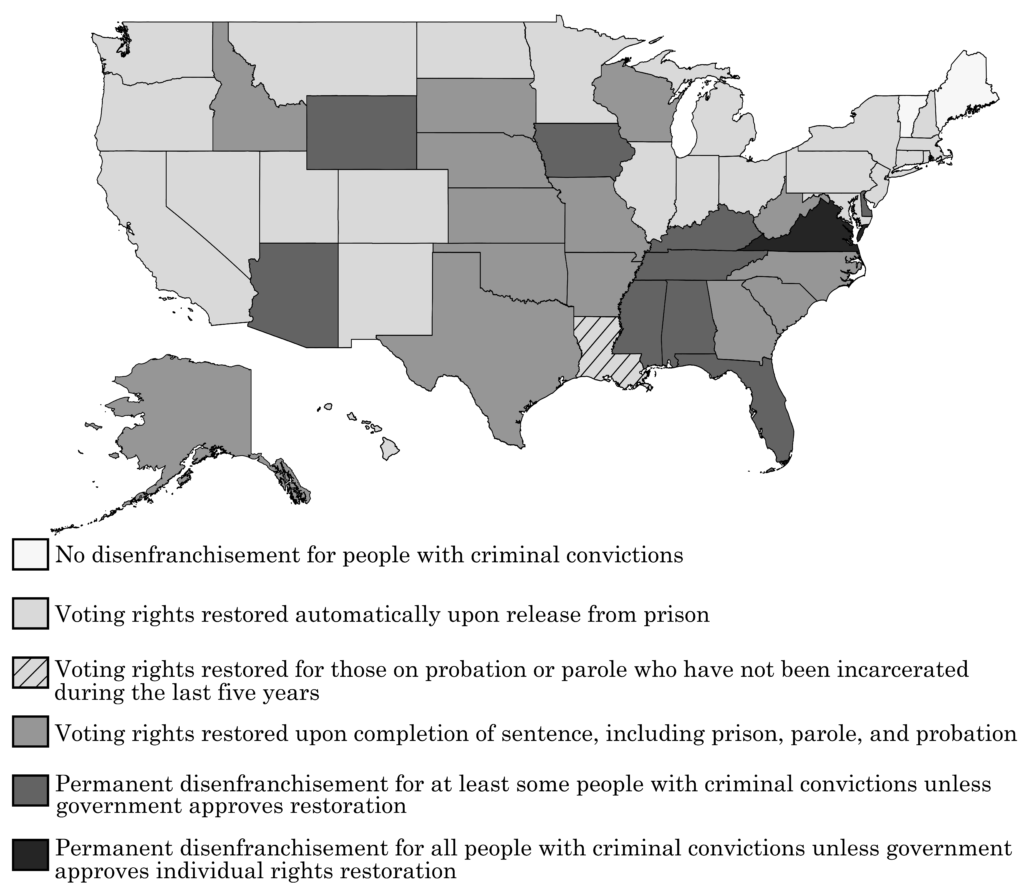
Source: Brennan Center, adapted/reprinted with permission.